Charts
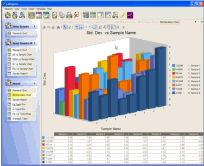 |
- 2-D and 3-D Charts
- Trend Charts with elapsed time intervals
- 12 Gallery styles - bar, line, pie, etc
- Automatic scaling
- Data Smoothing
- Zooming
- Series Overlay and Series Single-Step mode
- Upper and Lower Limit Lines
|
Limits
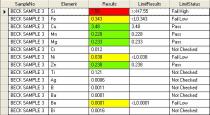 |
- Limit Checks
- Quality Checks
- Print Limits
- Screen Color-coding
- Pass/Fail Status
- Limit-check any value (e.g. Conc, Rsd,..)
- Multiple High and Low limits
- Failure data flags
|
Reports
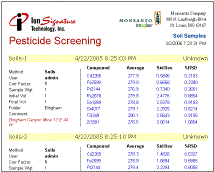 |
- Drag & Drop simplicity
- Built-in Sub-reports manager
- Headers and Footers
- Multiple "samples" per page
- Report Designer
- Full control over layout, fonts and colors
- Automatic page numbers
- Export to PDF, HTML, RTF (Word)
|
Export Table-Builder
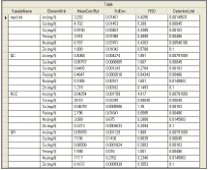 |
- Drag & Drop simplicity
- Organize data into flat tables
- Export Button
- Pre-define file path or ask for filename
- CSV setup options
- Map field names to export names
- Auto-Export (in Monitor mode)
- Export to CSV, PDF, HTML, RTF (Word)
|
SPC
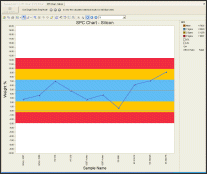 |
- 1,2,3-Sigma Control Limits
- Cpk - Process Capability Index
- WECO Probability Rules
- USL/LSL - Upper / Lower Spacification Limits
- R-Charts
- X-Charts
- Histograms
|
Calculated Data
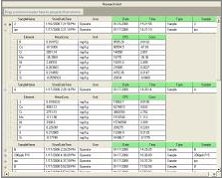 |
- Advanced Formula-Builder™
- Perform Calculations with Instrument data
- Math, String, Time, Statistics and Logic Functions
- Chart and Report on the Calculated Data
- Auto-Refresh when data changes
- Perform Corrections, Conversions and Pass/Fail logic
|
Monitor Mode
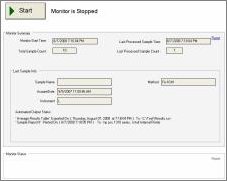 |
- Monitor Database in Real Time
- Filter Samples by Any Criteria
- Auto-Export to multiple destinations in multiple formats
- Auto-Print to multiple printers using different report layouts
- Collect multiple samples before printing to save paper
- Manual Re-send
|